Wondering which Gulf Coast spot will deliver stronger vacation rental returns: St. George Island or Cape San Blas? You want clear, local insight before you invest. In this guide, you’ll learn how revenue, seasonality, operating costs, and local rules affect ROI in both markets, plus a simple framework to compare properties side by side. Let’s dive in.
Snapshot: Two Panhandle favorites
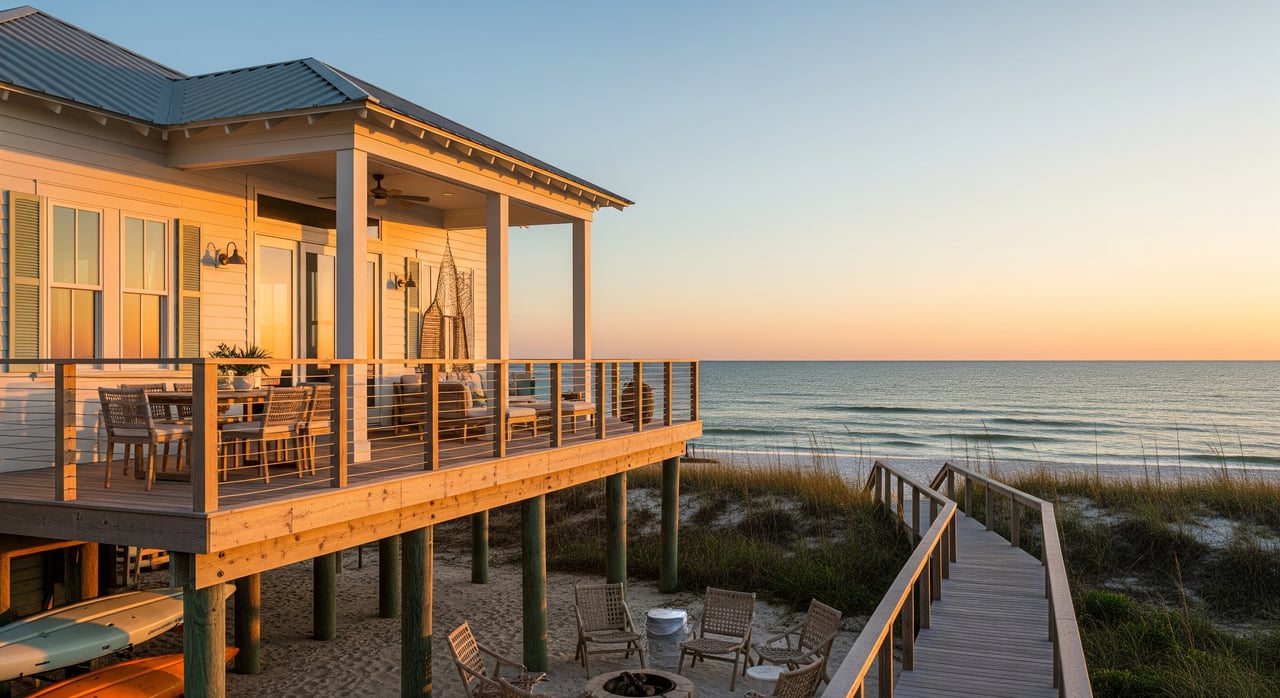
Both St. George Island and Cape San Blas are beach destinations with a mix of gulf-front homes, near‑beach cottages, and a smaller share of condos. Inventory is limited on narrow islands and peninsulas, which supports pricing power in peak months. Typical buyers are second‑home owners and out‑of‑state investors seeking seasonal income and long‑term appreciation.
What separates performance is not just the beach. It is your home’s view, bedroom count, condition, elevation, and how well you manage seasonality, fees, and upkeep. A solid ROI plan starts with those levers.
What drives rental revenue
Location and property type
- Gulf‑front or clear gulf‑view homes usually command the highest average nightly rate.
- 3 to 5 bedrooms with parking, outdoor space, and updated kitchens attract family groups.
- Newer or renovated homes, elevated above flood risk and built for storms, tend to book faster and at higher rates.
Seasonality and ADR
- High season runs from late spring through summer. Weekly summer stays are common and often yield your best ADR and occupancy.
- Shoulder seasons in spring and early fall can be steady with slightly lower ADR but efficient occupancy.
- Low season spans late fall through early spring. Snowbirds can help stabilize some winter weeks.
- Build monthly assumptions, not a flat annual average. Market tools like AirDNA market summaries help you validate ADR and occupancy by month.
How to price and comp
- Pull 6 to 12 comps matching bedroom count, distance to beach, and amenities.
- Check calendars and rates for peak, shoulder, and low months using live comps on Airbnb and Vrbo.
- Adjust your assumptions for view premiums, home age, parking, and special features like hot tubs or outdoor showers.
Operating costs that shape ROI
Management and platform fees
- Full‑service vacation rental managers often charge 18 to 35 percent of rental revenue, depending on services and competition.
- Platform fees vary by channel. Airbnb host fees often start near 3 percent, while Vrbo commonly uses a commission or subscription model. Verify current policies before modeling.
- Direct booking can reduce commissions but requires marketing, software, and guest support.
Cleaning and turnover
- Cleaning is charged per stay and scales with home size and scope. Many owners pass cleaning fees to guests, but frequent short stays still increase your cost per booked night.
- Weekly stays in summer can lower turnover count and protect margins.
Insurance, flood, and coastal upkeep
- Coastal properties face higher homeowner and wind coverage costs, plus potential flood insurance if located in FEMA flood zones. View maps and zone details on the FEMA Flood Map Service Center.
- Florida’s insurance market can be volatile. Review active carriers and trends via the Florida Office of Insurance Regulation.
- Salt air accelerates wear. Budget for routine maintenance and reserves for bigger items like roofs, decks, and HVAC.
Taxes and compliance
- Florida imposes a state sales tax on short‑term rentals. The base state rate is 6 percent, and counties may add a discretionary surtax and a tourist development tax. Review registration and rules at the Florida Department of Revenue.
- You must register with the state and comply with county reporting. Confirm current tourist tax rates and remittance steps with the local tax collector or tourism office in each county.
Local rules to confirm before you buy
Registration and permits
- Counties and municipalities may require short‑term rental registration, a business tax receipt, or inspections. Requirements can change, so check current codes for the specific address.
HOA and neighborhood rules
- Some HOAs limit rentals or set minimum stays. Always review covenants and community guidelines before making an offer.
SGI vs Cape San Blas: ROI factors
Purchase price and scarcity
- Gulf‑front inventory is limited in both markets. Scarcity can support premium ADRs, but acquisition prices often reflect that premium.
- Check recent sales and assessed values to anchor your price and property tax estimates using the Franklin County Property Appraiser for St. George Island and the Gulf County Property Appraiser for Cape San Blas.
Service ecosystem and management
- Access to reliable cleaners and maintenance partners can impact guest experience and your cost structure. Get fee schedules and response‑time expectations from local managers before closing.
Demand patterns and stays
- Both destinations see strong summer family demand and weekly bookings in peak weeks. Small differences by neighborhood or bay vs gulf side can affect ADR and occupancy.
Build a simple pro forma
Use a conservative base case and a sensitivity check. Here is a straightforward flow:
- Gross rental revenue
- Sum monthly: ADR_month x days_in_month x occupancy_rate_month. Include cleaning fees collected from guests.
- Gross income adjustments
- Subtract platform commissions and property management fees.
- Net operating income (NOI)
- NOI = Gross rental revenue − operating expenses (insurance, property taxes, utilities you pay, cleaning expenses, HOA, routine maintenance, supplies, marketing, accounting, software).
- Cash flow before financing
- Cash flow before financing = NOI − capital reserves and other recurring owner costs.
- Cash flow after financing
- Cash flow after financing = Cash flow before financing − mortgage principal and interest.
- ROI metrics
- Cash‑on‑Cash Return = Annual pre‑tax cash flow after debt service divided by total cash invested.
- Cap Rate = NOI divided by purchase price.
- Payback period = Total cash invested divided by annual pre‑tax cash flow.
Inputs and sensitivity checks
- ADR by month: build conservative, base, and optimistic scenarios using AirDNA market data and live comps.
- Occupancy by month: test plus or minus 5 to 15 percentage points.
- Management fee: compare self‑management vs 20 to 30 percent full service.
- Cleaning: cost per turnover times expected number of stays.
- Maintenance reserves: 5 to 10 percent of gross revenue, plus a CapEx plan for roofs, HVAC, and decks.
- Insurance and flood: get quotes and test higher‑cost cases, considering guidance from the Florida Office of Insurance Regulation and your flood zone via FEMA.
- Taxes: use property appraiser data for taxes and confirm short‑term rental tax rules at the Florida Department of Revenue.
What to gather before you buy
- Address or MLS number to pull flood zone, tax bill, and comps.
- Bedroom and bathroom count, square footage, view, parking, age, and condition.
- HOA rules and fees, if any.
- 3 to 5 comparable listings with monthly ADR and occupancy.
- Manager proposals with fees, cleaning costs, and on‑call maintenance terms.
- Insurance quotes for homeowner, wind, and flood.
- Utilities, septic or sewage details, and internet costs.
Local help for a confident decision
You do not have to guess. A strong ROI on St. George Island or Cape San Blas comes from accurate comps, realistic seasonal pricing, and a conservative expense plan. If you share a property address and your financing plan, we can build a custom pro forma, confirm flood and insurance realities, and connect you with local managers for hard quotes. For a grounded side‑by‑side of SGI and Cape San Blas options that fits your goals, talk with Chasity Hill today.
FAQs
What is peak season on St. George Island and Cape San Blas?
- Late spring through summer delivers the highest ADR and occupancy, with weekly stays common; spring and fall are shoulder seasons, and late fall to early spring is typically slower.
How much should I budget for management on these beaches?
- Full‑service short‑term rental management often ranges from 18 to 35 percent of rental revenue, depending on services and local competition.
Do I need flood insurance for a beachfront rental in these areas?
- Many island and peninsula properties are in FEMA flood zones, and lenders require flood insurance when applicable; check your exact parcel on FEMA’s map and get quotes.
What taxes apply to a short‑term rental in Franklin or Gulf County?
- Expect Florida’s 6 percent state sales tax plus county tourist development taxes; register with the Florida Department of Revenue and follow county reporting rules.
How do I estimate ADR and occupancy before I buy?
- Combine market data from AirDNA, live comps on Airbnb and Vrbo, and local manager input, then build monthly assumptions and test conservative and optimistic cases.